Category: Crypto Opportunities || Posted Aug 23, 2026
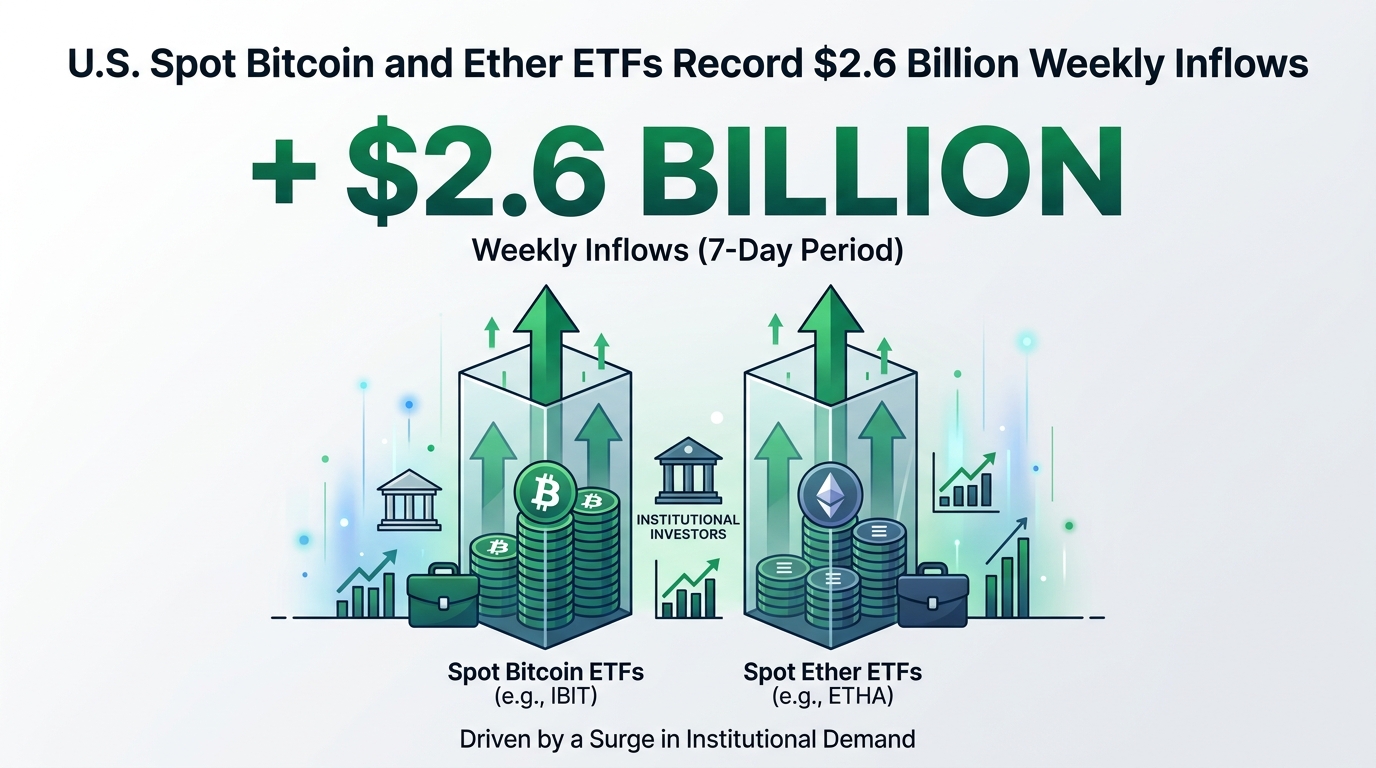
U.S. Spot Bitcoin and Ether ETFs Record $2.6 Billion Weekly Inflows Amid Surge in Institutional Demand
Wall Street’s $2.6 Billion Liquidity Dam Breaks
The institutional dam holding back traditional finance just gave way, and the resulting capital tsunami flooded Wall Street in a single five-day trading window.
After months of sideways accumulation, macro hesitation, and persistent spot outflows, capital returned to digital asset markets with undeniable force. During the trading week ending August 21, 2026, U.S.-listed spot Bitcoin and Ether exchange-traded funds (ETFs) recorded a staggering $2.615 billion in net weekly inflows.
This massive influx represents the single largest weekly capital intake for spot crypto ETFs since October 2025, effectively erasing the prior week's outflows and triggering a macro-level repricing across digital asset markets. Driven primarily by heavy institutional buying through BlackRock and Fidelity, the surge propelled total combined ETF assets under management (AUM) to $110.36 billion.
This was not a retail-driven FOMO rally. It was a calculated, programmatic deployment of balance sheet capital by institutional asset managers, sovereign allocators, and registered investment advisors (RIAs). The question now is whether this $2.6 billion tide signals a permanent structural shift toward institutional crypto adoption or merely an isolated burst of short-covering liquidity.
Breaking Down the August 2026 Inflow Mechanics
To understand the sheer magnitude of this institutional shift, we must examine the verified on-chain data, ETF flow breakdowns, and execution dynamics that took place between August 17 and August 21, 2026.
1. The Numbers Behind the Surge
Data verified by ETF analytical platform SoSoValue reveals an unprecedented five-day streak of positive creations across both Bitcoin and Ether products: KuCoin
- Spot Bitcoin ETFs: Absorbed approximately $1.917 billion over the five-day trading week, accounting for roughly 73% of total net inflows. The momentum built steadily each day—$297.56M on Monday, $189.30M on Tuesday, $517.19M on Wednesday, peaking with a massive $606.29M single-day haul on Thursday, August 20, before closing Friday with $307M.
- Spot Ether ETFs: Snapped a multi-week slump to draw $697.5 million in net new capital, completely offsetting the $391.96 million in outflows recorded the previous week. On Thursday, August 20, Ether ETFs recorded their largest single-day intake since October 2025 at $221 million.
- Institutional Concentration: Dominance remained heavily concentrated at the top. Asset management giant BlackRock accounted for the vast majority of net creations. On Friday, August 21 alone, BlackRock’s iShares Bitcoin Trust (IBIT) and iShares Ethereum Trust (ETHA) pulled in $390 million—representing nearly 79% of the entire market's net inflow for that session.
2. Price Revaluation vs. Capital Creations
While $2.615 billion in net new cash entered the funds, total assets under management across both Bitcoin and Ether ETFs ballooned by nearly $23 billion over the same seven-day period.
This disparity highlights a powerful financial mechanism: the ETF supply squeeze. As institutional market makers purchased physical spot BTC and ETH on open markets to back newly minted ETF shares, the concentrated buying pressure triggered a massive short squeeze. Over $3 billion in short derivatives positions were force-liquidated across global exchanges within 48 hours as Bitcoin rallied 18% to top $76,000 and Ether surged past $2,400.
3. Institutional Spot ETF Asset Breakdown
| Metric / Product Category | Spot Bitcoin ETFs (e.g., IBIT, FBTC) | Spot Ether ETFs (e.g., ETHA, Grayscale) | Altcoin ETF Suite (XRP, SOL, LINK) |
| Weekly Net Inflows (Aug 17–21) | $1.917 Billion | $697.5 Million | $81.47 Million Total |
| Dominant Fund Leader | BlackRock IBIT ($62.43B Cumulative) | BlackRock ETHA ($12.17B Cumulative) | XRP ETFs ($39.78M Weekly Record) |
| Total Category AUM | $96.07 Billion (~6.17% of Market Cap) | $14.30 Billion (~4.85% of Market Cap) | ~$530 Million Combined AUM |
| Trading Volume Velocity | $22.15 Billion Weekly Volume | $4.10 Billion Weekly Volume | $271.74 Million Record (XRP Volume) |
Before analyzing future market scenarios, interact with this visual model to see how sustained institutional ETF creations influence spot liquidities, short-squeeze mechanics, and asset prices.
Key Takeaway: Spot ETF creations require authorized participants to purchase real underlying assets on spot markets. When concentrated buying coincides with heavy short positioning in futures markets, small net capital inflows can trigger massive, exponential price revaluations.
Scenarios, Probabilities, and Future Trajectories
The sudden influx of $2.6 billion has broken digital asset markets out of their multi-month summer slumber. However, macro analysts and quantitative institutional strategists remain divided on what comes next. Below are the three primary forward-looking scenarios being watched by global trading desks.
Scenario A: The Sovereign & Pension Allocation Wave (High Probability)
The $2.6 billion inflow week may represent the vanguard of institutional model portfolio rebalancing.
- The 1% Portfolio Mandate: Registered Investment Advisors (RIAs) managing trillions in traditional wealth are increasingly adopting standardized 1% to 3% digital asset allocations within classic 60/40 portfolios. As wealth management platforms complete their internal risk reviews for spot ETH and BTC ETFs, systematic inflows could create consistent, non-cyclical buying pressure.
- Corporate Treasury Reserves: With traditional cash yields adjusting to changing central bank policy, publicly traded corporate treasuries are evaluating spot Bitcoin and Ether ETFs as balance sheet diversification tools that eliminate the custody risks of holding bare private keys.
Scenario B: The Derivative Arbitrage Loop (Moderate Probability)
Some market analysts urge caution, pointing out that not all ETF inflows represent directional "buy-and-hold" conviction.
- Basis Trade Capital: Institutional hedge funds frequently engage in "cash-and-carry" basis arbitrage—buying spot ETF shares while simultaneously shorting equivalent Bitcoin or Ether futures contracts on the CME to lock in risk-free yield spreads.
- The Reversal Risk: If futures basis yields compress below money market returns, hedge funds may unwind these basis trades simultaneously. This could result in rapid, sudden ETF redemptions that mirror the violent inflows seen in mid-August.
Scenario C: The Altcoin ETF Capital Rotation (Speculative Scenario)
While Bitcoin and Ether dominated headlines with $2.6 billion in new capital, altcoin-focused spot ETFs quietly extended their own winning streaks:
- Spillover Liquidity: Spot XRP ETFs recorded a record weekly volume of $271.74 million alongside $39.78 million in net inflows. Meanwhile, Solana (SOL) ETFs logged their eighth consecutive week of positive creations.
- The Layer-1 Diversification Play: If Bitcoin and Ethereum maintain elevated market caps, market sentiment suggests institutional capital could rotatively spill over into secondary tier-1 network ETFs (such as Solana, XRP, and Chainlink), establishing a broader multi-asset institutional landscape.
What to Watch Next
The historical $2.615 billion ETF inflow week has confirmed that Wall Street's institutional rails possess unprecedented power to alter crypto market structure overnight. Moving forward, investors and institutional observers should keep a close eye on four core metrics:
- Sustained Flow Continuity: Track whether daily ETF net flows maintain positive momentum over 10-day and 20-day moving averages, or if creations drop off following short-covering events. BingX
- BlackRock Concentration Ratios: Monitor the percentage of total daily creations captured by BlackRock’s IBIT and ETHA relative to the rest of the issuer landscape.
- CME Open Interest & Basis Spreads: Watch CME futures open interest to determine what proportion of incoming ETF capital is driven by directional spot buyers versus cash-and-carry basis trade arbitragers.
- Altcoin ETF Inflow Trajectories: Keep tabs on weekly capital flows into Solana, XRP, and secondary crypto ETFs to spot early signals of broader altcoin market rotation. CryptoRank
The August 2026 inflow surge proved that when institutional pipes open, liquidity moves at lightspeed. Whether this marks the start of crypto's next multi-month bull regime or a temporary liquidity spike, Wall Street is officially holding the steering wheel.
Disclaimer: This article is strictly for educational and informational purposes and does not constitute financial, legal, tax, or investment advice. Digital asset markets and exchange-traded products carry significant financial risk and volatility. Always perform independent research and consult a certified financial advisor before allocating capital.